Wednesday, February 29, 2012

Will AMZN be cut in half??

Traders need to pay very close attention when fundamentals and technicals line up.
On 2/19 I discussed a possibility of AMZN taking a serious dive.
Watch the video below to understand why my prediction may come true.
Nice to have one of the most respectable investors on my side.

click on chart to enlarge

Financial Market Update

To better understand what I am discussing here, please read my weekly trading notes...

Stock market has reached a zone of utter confusion and ludicrous ecstasy. I am starting to sound like a broken record, but at 13,000 on Dow there is no real resistance, it is all a hype, illusion, and total deception. To introduce yet another magnet of public money lure, Nasdaq touched 3,000 mark in the session, yet another useless milestone. If you want to use meaningful levels of resistance put a line through 13,137 on Dow and 3,029 on Nasdaq. I do not think we will get there though...

Gold had some faking to do here. It reacted negatively to the neckline of inverted head and shoulders. Precious never does what everyone wants, it illudes traders and then goes in the predominant direction. We should see it above $2K at some point, but it will not get there in a straight line. Let it rest and build the right shoulder some more...

Dollar is the main culprit of gold's sell-off today. Bernanke is testifying on The Hill, and it seems like his prepared statement made traders believe that QE3 is not a sure thing. I can't say I agree, but certainly do not mind the development...

This brings me to the last part - euro. Not only is it losing a little steam due to the dollar, but also it is reacting to LTRO. E529B was thrown out of the helicopter at cash-hungry almost-defunct institutions. They get to live another day... Perfect double top has developed on the hourly EUR/USD chart today. It is at neckline as I type - another opportunity to sell, even if you missed the quick whoosh lower. Do not blink this time...

Monday, February 27, 2012

SOX is Predicting NDX Decline

Last year I posted numerous times about SOX diverging from NDX. All of those times were the best shorting opportunities of the year. Today it is happening again.

While NDX is continuing to drink AAPL Kool-Aid, SOX has topped and diverged from 2/17. Let's quickly pull up 4hr chart and look at how SOX rallied to the top of the channel and got rejected twice, broke the trendline from 12/19 low, backtested it and got rejected along with the 3rd rejection at the top of the channel, and formed head and shoulders in the process. It sold off 4.6% from the top, while NDX did not even blink. Break and close below the neckline @ 418.52 will send the price to projected target of 398.41, which is also just above the 396 - 398 support zone from 10/27 and 11/16 highs.
I expect NDX to follow SOX down.

click on chart to enlarge

Saturday, February 25, 2012

Trading Ideas for Week of Feb 27, 2012

Dow 13,000 watch continues. As I said before, it is not only meaningless but also dangerous zone for traders. Those who are long from lower levels are looking to dump on unsuspecting new longs, as they get sucked in by the media's excitement. Even if Dow closes above the milestone, it represents a fake buy signal, since there is no real technical signal at this level. I am looking to short on jubilation event. The biggest conviction to do so is the fact that Transports have not confirmed this latest leg higher by Industrials. According to Dow Theory, non-confirmation by averages creates one of the best contrarian indicators. It has worked beautifully all of last year. Why should this time be any different?

click on chart to enlarge

I have been watching gold with amazement and deep respect. Yellow metal has been somehow able to once again hold its long-term trendline and muster a powerful rally. The inverted head and shoulders, which developed on the chart, has me scratching my head a bit. Can it be so easy? Projected target takes the price to a new high, just above $2,000. But where is the usual fakeout first? Necklines are a place of confusion at times. I suspect we will get some kind of shakeout pullback soon, as the right shoulder gets a little more time to consolidate.

click on chart to enlarge

Gold's pullback will depend on the dollar, which has not done well lately. DXY has been neglected, as the risk rally around the world gained steam. It seems like everyone has now forgotten the notion that strong U.S. equities will result in strong dollar. Market quickly dispelled that myth. Traders dumped the king and turned it into a toad. Look at how Dollar Index and Dow correlated in the last five years. They almost always move opposite to each other. I highlighted the times when the two moved in tandem. As you see it happened very seldom, and not even 100% correlated on those occasions.
So I think that if risk rally comes to a halt, dollar will rise.

click on chart to enlarge

Another development which may rescue the dollar is LTRO on Wednesday of this coming week. I do not know if euro sells off on the fact, or it may just start getting weaker before the event. My notion is that more euros in the system should eventually bring the exchange rate lower. I am not crazy about the idea of shorting yet, because of euro's strength against other currencies lately. EUR/JPY and EUR/AUD are breaking out above resistance levels. These crosses may be the reason why EUR/USD has continued its upward direction. Another reason for continued euro rally could be the remaining huge short position (reported in COT). I would wait for LTRO results and see how the market interprets them first, before putting on a trade. My bias on EUR/USD is lower. It is approaching the area where I would like to start establishing a new short. In order for downtrend to resume, series of technical breakdowns have to occur: inverted head and shoulders has to fail when price meets resistance at laminate of 200 day ema and top of the channel, then laminate of 20 day sma with trendline from Jan. low has to break, then price has to move below 50 day sma. It would be prudent to add to established short position on these breaks. Projected distance below the head would take EUR/USD to 1.1925, which should coincide with bottom of the channel.

click on chart to enlarge

Thursday, February 23, 2012

Roadmap for Light Sweet Crude Oil

With all the noise about crude oil in the last few days, I decided to show my roadmap for black gold.
I expect WTI to stair step higher, pause at $120 and $130, and then proceed to 2008 high. This development will not bode well for world economy. Eventually, demand destruction and double top will take care of the price. It will crash, just like in 2008, but should find support at long-term trendline, at around $100.

click on chart to enlarge

Wednesday, February 22, 2012

Dow to Pull Back 4 - 5%??

Dow Jones Industrial Average (DJIA) is trying to get above 13,000 on closing basis.
My mind is not set on this milestone, it is meaningless. While the media is hyping the development, traders are to be cautious and consider booking profits and/or going short. I think DJIA will have to pull back before another leg higher can take place.
To add some conviction to my statement above, let’s look at an interesting comparison between DJIA today vs. short-term top made on Nov. 5, 2010. It looks very similar on pattern and percentage basis. That rally resulted in 4.5% pullback.

click on chart to enlarge


Sunday, February 19, 2012

Trading Thoughts for Week of February 20

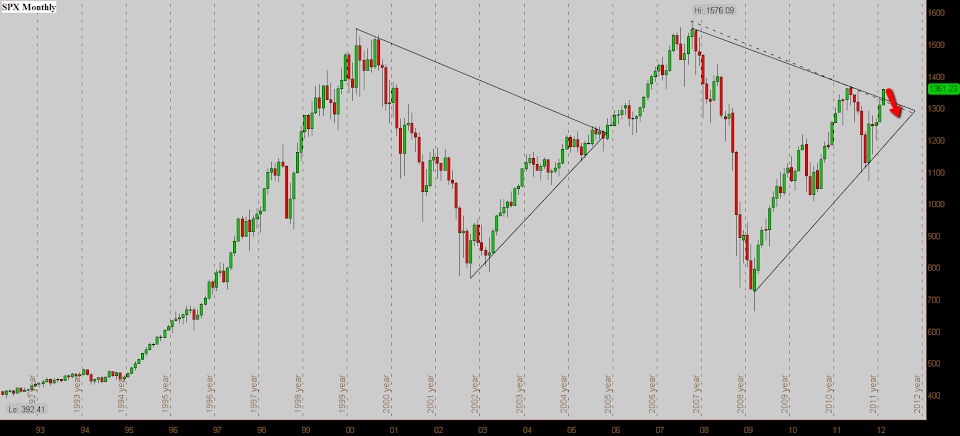
Virtually uninterrupted stock market ascent from December 20th continues. Shorting this bull move on the premise of market being overbought seems to be a fool's game. I carefully waited for credible selling levels, identifying them as confluence zones of resistance. Combined with momentum divergence and pattern studies I pulled a trigger a few times. While a few scaleouts got filled, the remainders got stopped out. One has to be patient and let the market do its punishing, only to reverse in the face of those exuberant and unsuspecting ones. I will be less defiant if SPX can get above 1370 and stay there. Above that level reward to risk is greatly diminished, as the next resistance level is way above. Continuing to be wrong on the short-term direction of the market is both frustrating and humbling. Perhaps I am completely out of touch. I expected SPX to stay inside the wedge for the first part of 2012 and break out in the second. This said, it can return back into the wedge just like in October. S&P 500 is now trading at 13 times 2012 projected earnings.

click on chart to enlarge
Chinese rulers (for the lack of better word) cut RRR again, even as CPI has climbed back up in January. Scared politburo is now ignoring its 4% consumer inflation target, while its is trying to revive slowing Chinese economy. With $3 trillion in their coffers, we have an absolute respect for Chinese leaders, as we expect them to save our Western civilization from all of our financial perils. I think it is likely that they will end up spending most of that money on domestic stimulus, to make sure less people die of hunger and neglect inside of their own country.
Let's look at what happened after the first cut of RRR on Nov 30, 2011. Shanghai Composite rejoiced the next trading session making a high at 2423 on Dec 1. It has not seen that price ever since. Even with a 10% rally from January 5th low, index closed at 2357 on Friday. The rally was in anticipation of second RRR cut. How long will investors celebrate this time? One is to be cautious, knowing what happened after the first time.

click on chart to enlarge
European leaders are once again outdoing themselves with shenanigans of epic proportions. I talked about ECB bond swap previously, it finally came. Supreme institution is going to escape the bond carnage without a scar, at the same time as private investors are taking a 70% haircut. Investor outcry should be starting about now!! Furthermore, we are learning that over the weekend EU leaders are feverishly searching for new ways to restructure Greek debt in order to bring it to 120% of GDP in 2020. If this is not the most ludicrous condition of Greek bailout, then I do not know what is. What will these geniuses think of next? Perhaps European Union can suspend the principles of economics altogether by 2020? I suggest they finally think about how Greece is supposed to grow its GDP after a harsh austerity has been imposed on it.
Look for market to start punishing "me too" EZ struggling peripheral countries' debt not a minute later after the Greek bailout is announced. Euro short-covering rally (on the bailout announcement) will be brief and will be met with new wave of selling. There are way too many shorts now though, so the rally is much needed to reduce that amount. Use 20 dma as a guide and be patient.

click on chart to enlarge
Based on last quarter's disappointing results and its weak forward outlook, I am wondering how AMZN is still trading at current level. It is known as a premium operation with innovative leader, the pioneer of online retailing. But declining growth rate and margins are going to hunt the stock going forward. It has underperformed in this recent tech rally (along with GOOG).  My conviction on the downward direction will get a boost if the long-term trendline breaks, which also happens to be at head and shoulders neckline. One is not to overreact, this trendline has to break first.

click on chart to enlarge
So I saved the best for last today. Bear with me through this last part, as there will be a trade of the year (related to this) at the end. And no, it is not to short U.S. Treasuries. We know what happened to that last year. Save your hard-earned money and stop fighting the Fed.
A few months ago I had a heated discussion (at a local bar) with another gentleman (not an investor) about America's sources of oil imports. While seemingly smart individual, he was completely ignorant to my arguments. So I finally pulled out my iPhone4 and showed him the facts, which immediately quieted him down (thank Gore for wireless internet). He was astonished to find out that U.S. gets more than half of its oil from Western Hemisphere, and a much smaller share from the Middle East. It is mind-boggling how misinformed the public is about this subject. So next time you want to win a bar bet, bring this subject up. Or better yet, the next time your elected politician says how "America relies on its enemies for oil", send him/her this chart.


But now on more serious note. With the above in mind, you have to wonder what Mr. Obama was thinking when he axed the Keystone XL pipeline. Canada is our closest ally, the friendliest of all oil sources. How many American jobs were not created because of the lost project? And finally the most important, what will we do when our gasoline possibly hits $4 and $5 per gallon this summer? Granted, that pipeline would have not helped this year, as it would take a while to complete, but the time to start was in 2010, when it was on the President's desk first! Endless delays are finally prompting Canada to ink the oil deal with China. Great!! Speaking of China, it is getting most of its oil from the Middle East and other "hot spots" around the world. It is recognizing the stability of Canadian oil supply and is ceasing the opportunity.


Today newswires are reporting that Iran is suspending its oil exports to UK and France. This will put even more strain on crude oil and gasoline supplies and boost the prices, just as Saudi Arabia reportedly reduced its oil exports.

So let's discuss the trade. I believe that this may become the best trade of the year. It actually already started for me, on December 29th, as I discussed in my post that day. But it gets better, or worse, depending on whether you are a trader or the consumer, which I am both. As the price of the gasoline hits $4 and $5 per gallon, retail sales are going to take a serious hit. So adding XRT short, as the price of gasoline continues to rise, makes this a more powerful trade. Interestingly, the two are usually moving opposite to each other, but have correlated in the same direction since depressed levels at the end of 2008. Look for that to break down as we near the $4 mark on retail gasoline. Obviously, the U.S. economy is going to slow down tremendously due to that development, because consumer spending is 70% of U.S. GDP. Hence SPX short would also work in this case. One important thing to remember is that at above $4 and surely at $5 per gallon the demand destraction will take care of gasoline price, and it will eventually start heading down, like in July of 2008 - by then retail sales were toast. So as soon as I start riding my bicycle and not my SUV to the grocery store, I will immediately announce the end of long RBOB trade here.

click on chart to enlarge

Thursday, February 16, 2012

GOOG Trade Update

Let's quickly update the Google trade. Price got rejected at just below 50 dsma and multiple resistance levels in the same confluence zone. A head and shoulders pattern has developed. Right shoulder is finalizing right now. Projected distance is still low 500s. I am short...

click on chart to enlarge

How Long Will Today's Stock Market Sell-Off Last?

It looks like 55-day long channels may finally be ready to break down. There were quite a few bearish intra-day reversals today among the recent market leaders: AAPL, NDX, COMP, XLK, XLF, XHB and many more. DJT has broken below the rising wedge with multiple confirmation closes. SOX has backtested the break of the uptrend and got rejected. It has diverged from NDX since close on 2/9/2012. There are multiple open gaps below on stock index futures charts, which may need to be filled. It has been a parabolic move from the beginning of the year.

click on chart to enlarge
But while the bears will be celebrating today's development, the bulls will be preparing their full forces to defend the support levels. It is important to note that while Nasdaq 100 (market leader) may look overextended to the upside, the 5th wave of the rally from March of 2009 may continue for some time. Look at the carbon copy of two sections on the following chart (highlighted in light blue). It is possible that after the sell-off which probably started today, there will be a lot more upside left. Charts have a tendency to repeat...

click on chart to enlarge

Tuesday, February 14, 2012

Is Copper Going To Crash?

As a trader I want to be ready for possible major moves in the market.
With this in mind I would like to share what I see in Copper Futures. In the last few weeks I have been waiting for a possible start of right shoulder formation, as a part of head and shoulders pattern on long-term chart. This possible development can lead to a pretty large move down.

Below is the weekly (on close) chart. It has a lot of information on it. But if you are familiar with charts it should be easy to digest. I am making a case for comparison to prior double-top (dt) pattern which led to projected distance (pd) sell-off once 31-month long neckline (nl) broke. Yes, it would be a dramatic plunge. I also understand that 2008 sell-off was a result of the GFC. I realize that fundamentals like improved U.S. new construction and insatiable Chinese demand will be going against my thesis here. But I am sorry, I am looking for a bearish case to take over soon, very soon, like right now! It is my chart, and I am the boss here... Just kidding... I can debate all of the fundamentals: while U.S. new construction has rebounded, it is still at very contracted level. Chinese copper imports fell in January (according to the latest import data), while stockpiles in China are only half of last year's level, making me believe that speculators and merchants are piling in (no pun intended) and are storing in preparation for continued demand, but China may have all it needs for now. I do not think that China can infinitely continue to build "ghost cities" just for the sake of employing its people.

click on chart to enlarge
To make things a little more convincing I also zoomed in on daily. You can see that it is conceivable that repeat of 2011 sell-off is about to ensue, which will lead to a larger sell-off that I am looking for.

click on chart to enlarge