With Thanksgiving upon us I would like to take the opportunity and thank all of my readers. To some of you my writing may not always be clear. Some of you may think that I sound offensive. And others may find me dogmatic at times. But most of you, I hope, think that I add value to your trading and investing. So I would like to reflect on my 17 months of blogging.
I began this blog with intentions to write an unbiased daily review of financial market conditions. But, as I now fully realize, my blog became my trading diary - a trade journal, depicting the views of a full-time trader. It also, hopefully, became a learning site for many starting and progressing traders. It became a chart hub, a tutorial on what to do with various setups, a guideline for trading around economic reports, corporate earnings, and geopolitical events. I am not sorry that my blog transformed into something else - I am proud that I was able to keep it up. So I would like to thank all traders and investors who came across my blog and made it their daily or weekly stop.
In this journal you have at your disposal most of my brains: my experience, my mistakes, my analysis, and my knowledge, which nobody can ever take away from me! You have to realize, that hiding in a maze of Internet garbage, there are priceless clues on how to succeed in professional trading. Some of them are here, on my blog - all for free. I was not always right - as the matter of fact, I was wrong many times - but I knew how to get myself to sustainable profitability in trading. Your profit and loss statement at the end of the year is all that counts. It is your achievement ranking, your ultimate goal, your only way of knowing if you will become a successful trader.
Do not try to copy me. It is virtually impossible to copy someone's trading style and make it your own. You can read all trading books in the world, but they will never change who you are. You will have to develop your own trading style which will be based on your level of comfort, your ability for analytical thinking, your desire to take a risk, and tolerance of one. You can start out small or big, on paper or with real money, with one account or many, trading forex, or stock index futures, or options, or equities, or commodities, or bonds, or whatever the heck you want. Just do not procrastinate, hesitate, delay, and waste your precious time - start trading now!! But if after many years of studying the skill of trading, you are still wondering if this is the profession for you, and just cannot put a trade together, then stop immediately and find something else to do. Folks, trading is one of the hardest professions on Earth, it is not for everyone. 95% of traders fail - an undeniable and very powerful statistic. The odds are not in your favor. In order to become a trader you have to persevere, dedicate yourself to this profession, concentrate your attention on all important details, learn how to admit and correct your mistakes, and most importantly - remain humble and be prepared to fail miserably.
As some of you may know, I like to take an extended break between Thanksgiving and New Year. In this period of time volumes get thin, intra-day moves get exaggerated, market action gets more choppy, and it becomes less desired time for swing traders like me. During the break I will monitor the markets and stay fully abreast of things. I will mostly not trade and keep my powder dry. I may write a post or two just to keep my hands warm. If you are profitable before this time of the year, you do not want to give back anything you have made in the last 11 months. This is solely my decision and does not have to be followed.
I deserve this break. I would like to reward myself for the hard work throughout the year. I hope you will understand my desire to rest, and will tune in for my updates starting in January of 2013.
My blog has been an amazing journey. 30,000 page views are a testament to my hard work.
Thank you for reading! Please stay tuned...

Wednesday, November 21, 2012
Monday, November 19, 2012
What Was That?
This question is on the minds of many shorts who could not get out of the way in the last two trading sessions. Some of my followers are probably new to trading and have absolutely no idea what happened on Friday and today. Nothing new happened!! Stock market moves the money from the accounts of those who do not know how to keep it to the accounts of the ones who know how to take it away. This is the basis on which stock market is built. If you are not sure what I am talking about, it is time to get educated, and do it before involving any more money in this game. I say this kindly, respectfully, but very assertively.
On Friday S&P 500 almost reached my first target of 1340, missing it by three points. I told you to "not get greedy and take what market gives you". Market has been trading very orderly, with beautiful setups and amazing respect to technicals. The picture has not been muddied by this two-day melt-up. Oversold bounce was expected and should be treated as a short-covering rally to sell into. Pick your spots to reshort wisely!
Let's get one thing straight. We have seen this before - politicians promising to avert the crisis. They calmed the worries down, put out the fire, and skipped town before reaching the deal. Ah, memories of TARP and Debt Ceiling come to mind. This time will not be any different, I say. The on-and-off-again nature of Fiscal Cliff deal negotiations will rattle the market like earthquake aftershocks. The most important thing you have to know is that the earthquake has already happened, all you have to do is prepare yourself for the aftershocks. They eventually come, without exception.
Wednesday, November 14, 2012
Is Australian Dollar Breaking Down?
I have been watching AUD/USD with big skepticism. On one hand AUD is benefiting from higher rates (compared to many other currencies), but most of the fundamentals are now stacked up against it. Australian economic growth is slowing, there is a real estate bubble in the country, resources boom is in early stages of peaking, and China has not exactly been a help lately. Speaking of China, I am a firm believer that new Politburo inauguration today is a sole reason for its latest improved economic numbers. How can China have 11.6% YoY export growth, when most of its biggest customers are hurting? Eurozone is sliding deeper into recession, Japan just entered another recession, and fiscal cliff in U.S. keeps most orders on hold. Anyway, we will never know what really goes on in that Communist-controlled country, but Australian economy greatly depends on it.
Let's look at some charts that are quite puzzling. FXI and Shanghai Composite are not exactly in sync. Copper and AUD/USD are not in sync at all. This does not make sense... Or does it? Could there be a quick resolution of divergence on the way?
AUD/USD may finally be ready to buckle under increasing risk-off pressure. It is in early process of breaking down. Price is now below the trend line, mid-range horizontal, and 4hr 200ema. 1.04 should now become the resistance, and successful backtest would trigger more short entries. I would use the bottom of the 440-pip trading range as a target.


 |
| click on charts to enlarge |
DAX - More Downside?
DAX is resting on the laminate of very important horizontal support (from which it absolutely collapsed last year) and lower line of bull flag (which has formed). Should things get a bit dicier, the price will break those supports and head for the target zone below.
 |
| click on chart to enlarge |
Monday, November 12, 2012
Buy This Dip?
There has been a lot of noise made by all the usual "I bought this dip" suspects over the last few trading sessions. I can't stop myself from saying: do not end up holding the bag!
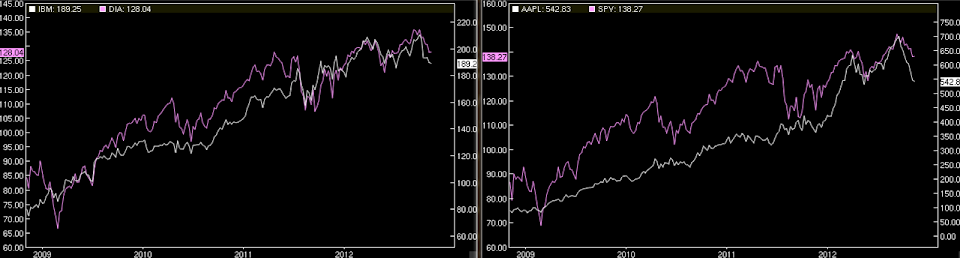
Many of you probably remember what I said in my October 18th post "IBM - Crucial Test" - I said that if IBM breaks down, this bull market is over. IBM is one of the most influential stocks (in my opinion), because it measures the health of enterprise market. Well traders, IBM is toast.
Let's look at the charts. First, I would like to draw your attention on how IBM correlates with Dow Jones Industrial Average, even closer than Apple with S&P 500.
Secondly, multiple supports have been broken. A few box extensions have been reached, and double top at that level has occurred. Many major long-term moving averages have been breached, with monthly 21 sma about to go as well. On weekly I showed a 4-yr channel, which is now gone. Leg 3 of 5-wave decline is under way. On daily I showed multiple horizontal supports to trade against, in case you were lucky to be short. Cover some of your shorts at those levels and trail your stops on remaining portion to above resistance, as the price will want to go back up to backtest (like recent 200 dsma backtest, which was successful).
It is too early to predict, but I think that IBM gave us heads up - bear market may have begun.
 |
| click on charts to enlarge |

Saturday, November 10, 2012
Another Cliff To Watch
While so many traders are preoccupied with fiscal cliff, I am more worried about another cliff. Below is the correlation chart of Copper Futures and PHLX Semiconductor Sector Index. It is amazing how closely they track each other. These are the backbones of industrial and technology sectors.
This chart is my biggest reason for staying bearish. At the time when SPX and other stock indices made 4-year highs earlier this year, HG and SOX did not even come close. Enormous head and shoulders pattern has developed. Though it is important to identify that every time they looked like they were about to break down, they bounced and moved higher.
200 wsma is the neckline - the cliff. What will happen this time?
 |
| click on chart to enlarge |
Thursday, November 8, 2012
SPX Target Zone
Now that 1400 is gone, SPX is firmly in sell-the-rallies mode. Let's assess a possible target zone for this surprising move. Why surprising? This is not what most on the street expected. We are in the middle of what is usually a very bullish time of the year. With most of the year-end targets at 1450 - 1500, trade below 1400 is making a lot of market players extremely nervous. Situation like this results in forced selling of late long positions (chasers) initiated above 1400, which itself feeds even more selling by momentum traders, who will be selling on multiple technical breakdown signals. Those longs who got into SPX at lower levels will also want to lock in and protect their profits, and will sell here as well. That's a whole lot of sellers at the time of slower earnings growth, U.S. fiscal cliff, and Eurozone worries at the forefront.
I put together a quick chart to display what levels this move may be targeting. Do not get greedy, take what market gives you, and expect short-covering rallies on the way.
I put together a quick chart to display what levels this move may be targeting. Do not get greedy, take what market gives you, and expect short-covering rallies on the way.
 |
| click on chart to enlarge |
Tuesday, November 6, 2012
GOOG - Scary Chart Comparison
I like this chart comparison even better than my AAPL prediction. Strong resistance comes in between two light blue horizontals. Rejection in that sell zone results in very steep sell-off...
As always, this is not an advice to trade.
As always, this is not an advice to trade.
 |
| click on chart to enlarge |
Sunday, November 4, 2012
Is Euro In Trouble Here?
Euro ran into formidable resistance. There may be a test of horizontal support (light blue line) coming soon. Below that it gets a little ugly...
 |
| click on chart to enlarge |
Saturday, November 3, 2012
This Could Happen Again!
With two trading sessions left before Presidential Election, traders are positioning themselves for the outcome. But very few of them, if any, are prepared for the worst scenario - no winner for days, weeks, or even months.
In 2000 it took 35 days and Supreme Court decision to stop perpetual vote recount. During that highly contested election - when "dimpled", "pregnant", and "hanging" paper ballot chads were scrupulously examined with magnifying glass by Florida judge - S&P 500 lost 100 points in four trading sessions after Election Day, and continued lower into the end of the year.

 It could happen again this time. According to the latest voting polls, the candidates are currently locked in statistical dead heat, especially in "swing states". It is very possible that many traders ran for the exits on Friday due to this uncertainty.
Be prepared for this scenario and have a plan of action ready.
In 2000 it took 35 days and Supreme Court decision to stop perpetual vote recount. During that highly contested election - when "dimpled", "pregnant", and "hanging" paper ballot chads were scrupulously examined with magnifying glass by Florida judge - S&P 500 lost 100 points in four trading sessions after Election Day, and continued lower into the end of the year.
click on images to enlarge


Be prepared for this scenario and have a plan of action ready.
Thursday, November 1, 2012
S&P 500 Futures Sell Zone
ES has entered a sell zone. This area is loaded with laminates of resistance:
Do not even think about taking this as an advice to trade. Do your own research please!!
- Horizontals @ 1424, 1431.50 & 1435
- 4hr 200ema & 200sma @ 1424 & 1435
- 50dsma @ 1428.50 (not shown on this 4hr chart)
- 50% and 61.8% Fibs @ 1426.25 & 1434.25
I will use this opportunity and sell more ES in this 1424 - 1435 zone.
Do not even think about taking this as an advice to trade. Do your own research please!!
 |
| click on chart to enlarge |