Wednesday, May 30, 2012

S&P 500 Futures Supports

The ugly tape is starting to scare longs away. There is nothing wrong with flattening your position if you can't sleep at night. Banking problems in Spain are now at the center of the attention. It is an epic battle out there, and I can smell the bulls' blood on the street.

Speaking of Spain and the bulls on the street... In beautiful Spanish city of Pamplona, there is an annual festival - San Fermin - which takes place in July. The main attraction of the festival is running of the bulls, where the brave men try to outrun the angry cattle through the narrow streets of the city. Unfortunately, a few of those men do not make it and get run over by the bulls.
Do you sense my not-so-hidden message? I think San Fermin festival may get an early start this year... When you see stampeding bulls, just get out of the way!

I would like the following support lines to hold.

click on chart to enlarge

Sunday, May 27, 2012

Weekend Trading Notes On May 27, 2012

I am hearing increasingly larger share of market technicians lean toward the idea of selling SPX rallies. It seems that majority of them is now expecting a retest of flat on the year, 1257, to be the launchpad for the next big rally. While I used to agree with that scenario, I am no longer a big fan of it. Stunning similarity on chart below gives me the base for becoming more bullish on SPX. You see, in the beginning of the year I thought that it would not break out of symmetrical triangle until the later part. But now that SPX is backtesting the occurred breakout back to the broken resistance, upper trendline of the triangle is serving as a formidable support, which should result in a bounce to much higher levels. 
As a trader, I would like to reserve the right to change my mind and always trade what I see. Should the price have a daily close below the established low of the current monthly candle, it will give the flat-on-the-year scenario more weight.

click on chart to enlarge

Tuesday, May 22, 2012

Longs' Wish List

It is now obvious that maximum pain in stock market is up. Traders went short, flat, and reduced on last week's horrendous performance. There is nothing new to that. When charts tell you to reduce the risk you do it. But my notion has always been: do not do what everyone else does all at once. So I would rather be long and sell the rip to 1400 on SPX, as those who are out need to get back in on the fear of missing the rally. There are pretty smart folks out there talking the market down so they can get back in. I presume their entry levels were staggered around 200 dma on SPX. Well, we never got there...

Let's put together a small wish list for those who are climbing a wall of worry higher at the moment (yours truly included).

1. We do not want AAPL up $30 every day, but we want it back above 50 dma
2. We want a broad participation by all market sectors, like yesterday
3. We do not want closes on the lows, let alone consecutive ones like last week
4. We do not want late-day sell-offs, absence of one yesterday was impressive
5. We want JPM and CAT back above 200 dma to aid XLF, XLI, and DIA
6. We want FB to continue cratering and all that money back into other leading market names, and stealing the spotlight of media's attention, thus keeping economic headlines on the second page
7. We do not want to close below last week's lows on AUD, CAD, and EUR
8. We want gold to do nothing from here and confuse the hell out of "talking heads"
9. We want Merkel and Hollande to kiss at tomorrow's EU summit (just to make Sarkozy mad), which would trigger 2% DAX and CAC rally
10. We want Greece to dominate the headlines and keep Spain in the background
11. We want Richmond Fed to be lost in the shuffle and not show deterioration in Mfg growth, even though employment component was pretty good (surprisingly)
12. We want all the skeptics out on TV saying 1330 on SPX will be the top of this rally
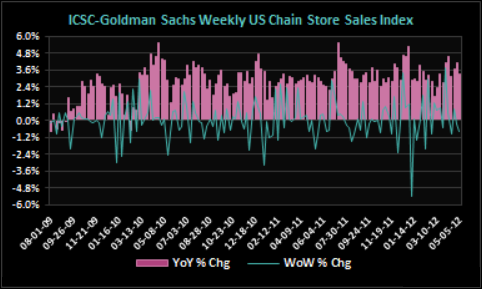
13. We want weekly retail sales to improve after today's Redbook and ICSC-GS disappointing WoW reports
14. We want DAX back above 6,450 and Nikkei back above 9,000 and stay there
15. We want China stimulus talk to continue, thus giving CRB a lift
16. We do not want bad China and EZ PMIs on Thu

OK, the list turned out to be not so small... But I would settle for half of the above, and it would still send SPX to 1400 by Greek election on June 17, which I did not even mention.

Saturday, May 19, 2012

Weekend Trading Notes on May 19, 2012

Those of us who were looking for a bounce on Fri (based on many oversold indicators) got our butts kicked. Market decided that red color is in vogue, and multiple consecutive daily closes on the lows are making me very nervous. This said, I would like to remain constructive and not panic, as it is never the thing to do when you trade. So I will make a case for longs here until 200 dma on SPX and DOW is broken on closing basis. Those who are short and reading the following notes, may want to consider covering at least a portion of their position, but more importantly, should be praised for their action as longs are now clearly losing the battle on so many fronts.

The biggest reason for initiating and/or holding an established long here would be QE3, which is now clearly being priced in the market, but NOT on equity side yet. In the last few trading sessions Gold, CRB index (which gold is also a part of), and Euro, have all diverged from SPX and are signaling Fed possibly coming to the rescue of slowing economy.

GLD/SPX

CRB/SPX

FXE/SPX

Since QE3 is just a hope, and hope is not a strategy for trading, let's discuss the reality. There is a strong technical support on SPX at this level. I would like to draw your attention to a confluence of 6 lines on the following chart: 3 fibonacci retracements, 1 horizontal, 1 trendline, and 1 double top extension below the broken neckline.

click on chart to enlarge


Thursday, May 17, 2012

Quick Market Note

Today SPX reached a capitulation phase, which I was looking for on Monday. It is important to point out that TNX inched closer to lower boundary of the channel I showed yesterday. CRB is holding up well, as QE3 chatter picked up today after atrocious Philly Fed, but it actually started to hold on its own yesterday, probably due to the support zone which I pointed out on Tuesday.
In my very humble opinion, all of the above marks an interesting level of entry for longs here. I am now long SPX futures and foresee a tradeable bounce towards 1370 - 1400. I am also trying EUR long here on my view of retracement back to 1.29 - 1.2950 level.
As always, be careful and do your own research, because I could be totally wrong...

Wednesday, May 16, 2012

Keep TNX Channel In Mind

I hear this constant daily noise about where U.S. 10-yr treasury note yield is going. It seems that both bulls and bears are too busy fighting and need to pull up the long-term chart. There is a 26-year-old descending channel in place.
We truly live in different times now, when there are very few choices for a safe haven left. U.S. 10-yr t-note is definitely one of them. But when I look at the chart below, I see that every touch of the channel boundaries was followed by a reversal. Keep this chart in mind the next time you hear a talking head tell you where the long-term interest rates are going.

click on chart to enlarge

DAX Backtesting

DAX futures are backtesting a broken horizontal support. It is important for the leading European stock market index futures to get back above 6450 and stay there for risk rally, which started this morning, to continue.

click on chart to enlarge

Tuesday, May 15, 2012

CRB Index Entered Support Zone

Everyone is down on commodities nowadays. While it is hard to argue with fundamentals behind the one-year-old decline (from higher dollar to lower demand), this asset class is now so universally hated that it may be due for a nice bounce. CRB Index entered a support zone, which I think will hold.
SPX staying above 1300 is an integral part of this possible bounce.

click on chart to enlarge


Monday, May 14, 2012

Torture, Capitulation, Rally

I can not characterize this stock market action by any other words. Slow-motion train wreck on low volume, which will be followed by a fall off the cliff, and then we will rally. I am seeing no bulls on TV any more. Everyone is quiet, leery calm. I want to see VIX shoot to 23. I want to see big volume spike on the move below 1333 on SPX futures, a quick whoosh down. I want "decoupled" bulls washed out, as they doubt their ridiculous theory. Next 24 - 48 hrs are important...
And then... I want to start taking shots at longs beginning around 1320 - 23 on SPX futures, and scale into longs from there. Nothing travels one way forever. Bounce should be good enough to trade. And after the bounce we will go down to test 1300 SPX cash. Nice two-way action is what I am looking for. Let's see what happens...

click on charts to enlarge

Saturday, May 12, 2012

Weekend Trading Thoughts on May 12, 2012

It has been a while since I posted charts. I know you were hungry for them... (click on charts to enlarge)

Let's update the latest macro developments first, and I am sure that I will repeat some things most of you already know: from European train wreck resulting in possible enterprise IT spending slowdown (despite INTC reaffirming guidance), to JPM's trading mishap weighing on too-big-to-manage banks, to China's slower growth (weakest Industrial Production growth in 3 yrs was just reported), to slower growth in U.S. as well.
Watch U.S. Industrial Production, Regional Mfg Surveys, and Retail Sales next week. On the latter - by far the most important report next week is going to be monthly retail sales on Tuesday, as slower consumer spending growth is now showing up in weekly chain store sales...


So the underlying macro theme is slower growth everywhere, also reflected in reports from India, Brazil, and Australia. This can not be good for equity markets around the world, especially heading into slower part of the year...

That said, one has to wonder how much of the above has already been priced in. Investors have been fleeing U.S. equity mutual funds for a while. Investor sentiment (% bullish) is getting to very important contrarian levels. Many risk charts (world equities and many commodities) have been breaking down since March, and only now "the general", U.S. stock market, is catching up with the rest. In old-school theory, a bottom is near when the generals get shot. How near?? SPX 1300 would be my best guess...


% Bulls/SPY

CRB Index/SPX

SPX/Germany/China/Brazil

SPX/Japan/Australia/India

SPX/Italy/Spain/France

SPX/Oil/Copper/Gold

Thursday, May 10, 2012

Monkey Wrench

Longs are getting rude awakening tonight. JPM mess is going to kill their hopes of overtaking 1370 on SPX. This said, I am advocating for shorts to still cover at 1330, if not already out. Why? If market takes a shot at that area tomorrow, we may see a bounce and may not retest until Mon. You will have plenty opportunity to have a run at that area again, but weekend may bring some unexpected European news, which may gap up the futures into Mon. Simple reward/risk ratio here, nothing more...

Quickly on JPM. I am assuming Mr. Dimon did not know... Let me rephrase that, longs are praying he did not know about the magnitude of the problem. If he did, God help JPM and banks... Because if he did, it makes for a pretty crappy risk management at what many regard as the highest financial institution, which may now look virtually unmanageable due to its enormous size (imho).
I bet Mr. Dimon wishes now he did not openly confront Mr. Bernanke on June 7, 2011, when he launched at Fed Chairman with a rant about Fed's inability to calculate dire consequences of excessive regulatory burden on banks. Not taking any sides here... :)

Cisco's Message Is Loud And Clear

Cisco is sending a message to traders: "it is no longer safe to hide in tech". Weak guidance from CSCO is going to resonate for a long time. Do not look at today's action alone, it is just the beginning. Do not listen to CNBC telling you CSCO is no longer a tech bellwether. Pure unadulterated nonsense!
Market has a tendency (lately) to delay the reaction. So give traders 24 - 48 hrs to digest and sell everything tech with enterprise spending slowdown exposure, especially if European train derails. Use higher levels due to brief short-covering (which I expected) to sell tech, especially going into Facebook's IPO, which I personally think will be a major top for all tech.

Still no charts and no time to go deeper into the macro news. I am catching up and will put a long post together soon. Stay tuned please...

Tuesday, May 8, 2012

And Now All Together: Sell

I am not a big fan of crowded trades. When all traders do the same thing, the opposite result is almost certain (at least on short-term basis). We may not quite be at that point yet, but are probably near it (a few days). Traders are now all over the media pushing their short ideas. They were all long before and looking for 1440 on SPX, and now all of them want to be short. Pick a good spot to cover and stick with it, I say. The sudden excessive bearishness will do its trick. I personally like 1330 - 33 on SPX futures as the last short scale-out target and a good spot to go long on a scale-in initiation. Let's see if we can get there by Thu afternoon or early Fri and have a nice short-covering squeeze into w/e, just to mess shorts up and get their stops. It still would not change the overall bearish picture, but would reset the charts and sentiment for a bit, and set up another short entry. The next selling opportunity may be even better, but has to be somewhat higher than here, and with less traders being short.

I apologize for lack of deeper coverage...
Hoping to have more for you in terms of charts and macro thoughts soon...

Stay safe!

Monday, May 7, 2012

Confusion Creates Opportunities

Market is continuing to be in confused state this morning. Players are coming and going, it's a noisy affair mostly centered around the results of European elections.

I say do not confuse a two-way local traffic with a one-way highway heading south. We have so many levels on the downside to test and so many open gaps to close after Friday's breach of supports on all risk charts.
Confusion brings opportunities to those who are not short yet, and also makes for good long entries on short-term charts (but be quick on longs here, imho). Established shorts scaled out and are ready to add at higher levels, I bet.
Stay focused, look for retracement that suits your style of trading, and pull the trigger when you are ready. The sell-off is by no means over...

Friday, May 4, 2012

Buckle Up! Super Moon Is Here

On Saturday, May 5th, super moon will illuminate the dark night. Lunatics will flock to their telescopes attempting to find the extraterrestrial life on the moon, while stock market traders will probably be hiding in the foxhole, spooked by the big bowling ball in the sky. Moon has a mysterious way of affecting everything on Earth, including the financial market. Extra high market volatility is present when there is a full moon. Do not ask me why...


Interestingly, full moon usually brings a rally, and we may see one on Monday. But this time there may be an inverted affect, as all risk charts are now breaking down, including SPX, especially if head and shoulders neckline does not hold.


We had two very important data points to pay attention to this week: NFP and Chain Store Sales. Both disappointed and sent the bulls to the exits. I am now in the bear camp and would like to short the retracements (especially on Monday after full moon). It is a simple "Sell In May And Go Away" trading exercise, and nothing more than that. Aided by the slower econodata from around the world, this old-school tool should yield some outstanding profits for aggressive sellers.

Be well, and watch the super moon on Saturday night.

Tuesday, May 1, 2012

Not So Fast, Wait For NFP

Today's stock market price action looks like a case of short-covering panic. Traders pushed the buy button as soon as they saw ISM Mfg PMI. While the report looked very solid on all components, I would like to concentrate your attention on the employment index. It is very important to identify that while this component has been rebounding since Nov of 2011, it certainly looks like its rate of expansion peaked earlier last year. Below you will see a chart going back 40 years, which shows that after each recession and a deep dive, manufacturing employment rebounds sharply, but expansion rate hits a brick wall at around 60. Obviously, "this time could be different", but with many facts pointing to how structural the unemployment currently is, it would be hard to imagine that we will break a 40-yr trend. I identified (with white arrows) where I think we are in the current post-recession cycle compared to the previous ones. The latest improvement may be a retracement before another move lower.

Shorts panicked when they saw this morning's ISM report, perhaps because Mfg is such a leading sector of the economy, and they thought that NFP later this week could surprise on the upside as well. I personally think that it was too premature to jubilate, and think that ADP tomorrow morning will give us a better hint on what April's NFP may look like on Friday.


click on chart to enlarge