Saturday, December 29, 2012

Retail Sales Conundrum

There has been some confusion and trepidation about holiday retail sales over the last week. Things got a bit hairy when Mastercard's SpendingPulse and ShopperTrak holiday shopping estimates came out. But ICSC contradicted the gloom with its "on-track estimate for November-December season forecast".

Retailers had a better handle on inventory for this holiday shopping season. They did not have to discount as much due to that fact. The earnings may be quite surprising. Let's also wait for chain store sales next week (on Jan. 3), before drawing any meaningful conclusions.

XRT came down to solid long-term support.


click on charts to enlarge

Happy New Year!

It is the last weekend of 2012. Stock market is resting, tired from being whipsawed by never-ending political saga. I like to study weekly charts on weekend, when it is quiet and daily noise does not distract me from the big picture. I care not to get involved in finger-pointing, blaming one or another party for dysfunction, or even thinking about a possible capital gains tax increase. All I worry about is where the market is going next week.
Weak longs, who were selling in panic on Friday, may be chasing the market higher in just a few days. Just like the debt ceiling debacle in 2011, fiscal cliff nonsense is creating an opportunity for a good long entry. Those who can see beyond the end of their nose may be handsomely rewarded.
Pull up the weekly charts. Do they look really bearish? Or is this just a pullback in continued uptrend? Be true to yourself. Trade what you see. And don't forget to change your mind when charts and fundamentals change.

Happy New Year!

Sunday, December 23, 2012

SPX - Super Bull Scenario

A few days ago I received an email from a very good trader friend of mine (we traded together in few chat rooms). He said that "looking at the charts", he "kind of thinks we might have a super bull on our hands". I responded by saying that "it was too early to tell... that we are still bound by the double top at 1552 - 1576 on SPX... unless we break above it and stay there, we are vulnerable still... cyclical bull in secular bear is what we have now..." I did say that "this still gives us plenty of room to go up next year..."

After a few days of thinking I decided that Super Bull scenario cannot be ruled out. What if "secular bear" conventional wisdom is all that market needs to demolish those previous tops at 1552 and 1576 in contrarian style? What if bears are all wrong about fiscal cliff, recessions in Eurozone and Japan, and China slowdown affecting U.S. growth in 2013? We are just 10% below the all-time high. Fed, ECB, BOJ, and PBOC will continue to stay easy. Our economy and corporate earnings may surprise on the upside. And yes, some of that bond market "mattress money" may end up in stock market next year.

So with the above in mind, I put together a weekly on close chart of what this Super Bull may look like next year. At projected target of 1680, SPX will have to blow passed the all-time high, and go up 17.5% from Friday's close.

click on chart to enlarge

Tuesday, December 18, 2012

Beware of a Fakeout - Part 2

There could be a pullback opportunity for those who missed this rally. I updated the chart to reflect where we could possibly be compared to former similar structure on the chart. I am still expecting that this breakout is fake, and will be sold, with price returning back into the triangle. After that happens, price may begin another ascent higher.

Update on Dec 20 @ 9:20 pm

Maybe I should have used another f word (instead of fakeout) to better describe what just happened to S&P futures. We just experienced a mini flash crash in ES...

click on chart to enlarge

Monday, December 17, 2012

Beware of a Fakeout

We may have a little bit of a fakeout here, at the apex of the triangle. We always do...

click on chart to enlarge

Sunday, December 16, 2012

Apple Obsession

For years people have been obsessed with this company, its products, and its stock. And for the last 90 days I have been obsessed with its weekly chart.

Weekly 34 and 89 EMAs (both Fibonacci numbers) supported the price for most of the past eight years. Slow Stochastic is scraping the bottom, and is sitting just above the long-term horizontal support.

I am still expecting a respectable bounce in this $500 area, which should provide upside bias for SPX.

click on chart to enlarge
 

Saturday, December 15, 2012

Friday, December 14, 2012

A little housekeeping

In this day and age of twittersphere and blogosphere, where many traders are living in a fantasy world, it is important that I remain honest to myself and my followers.

I have been bearish China all year long. But I had a plan which I adopted here a few weeks ago, and even Tom DeMark told me that I should, that if SHCOMP weekly chart has two consecutive closes above 2K - the demarkation line (misspelled intentionally) - it would be time to cover shorts in FXI, and look for longs on pullbacks. Well, SHCOMP is screaming above 2100 tonight. Yes, on very long-term charts I showed here earlier, this latest rally from below 2K looks like a blip. But one should not forget that we do not live in imaginary world, and real money is on the line. Nobody can assure that SHCOMP will not continue to go higher, and wipe out a year-long of bears' profits in the process. Unless you are Jim Chanos (who is a big China bear), and you can withstand another 200 points of straight up action, you have to cover this FXI short.

I brought a knife to a gunfight. It's time for China bears to lay their picks and shovels down, and wave a white flag in front of bulls' heavy artillery. No matter what and who is behind the move - respect the price, put down the farming tools, and surrender. Live to fight another day.

Note to self: cancel Kung Fu lessons.

Update on Dec 14 @ 12:15 pm

Here is everything I talked about in a 3-minute sound bite. But no matter who is doing the buying, you have to get the heck out of the way.
 

Wednesday, December 12, 2012

From Greenspeak to Helicopter Ben (corrected)

Federal Reserve has come a long way from Greenspeak to Helicopter Ben. I am not sure what is better - an incoherent mumbling of Greenspan or Bernanke's transparent and detailed press conferences. In order to comprehend the outcome of FOMC's verbal communication with the market, one has to look at what happens when the Chairman speaks at the presser. Click on chart below to see the breakdown for this year, and what I think about today's market reaction.

(due to poor quality) read my note on graphic here instead:

Market's reaction to Federal Reserve Chairman's pressers has been mixed this year. Two times the market sold off for 3 days, only to bounce and rally strong. April press conference was followed by a brief bounce, and then a steep sell-off ensued. And September QEInfinity announcement has marked the top (so far). Only time will show what today's "Evans Rule" policy will do to the market. As a trader, I would not get involved in lengthy discussion leading to further confusion, and would simply follow the path of inverted head and shoulders on SPX chart. So, a brief pullback is to be succeeded  by continued rally into the end of the year. 

click on chart to enlarge

Thursday, December 6, 2012

Could This Be Our Roadmap Ahead?

I see very cheerful market going into the holidays, and then really depressed after that.

Happy Holidays!


click on charts to enlarge


Wednesday, December 5, 2012

Anatomy of a Bubble

Tom DeMark is kicking my butt. It's only the beginning of the movie though. I have not learned all of my Kung Fu moves yet...

Before everyone gets too excited about last night's Shanghai Composite rally, I wanted to show what it looks like on longer than a 15 min chart.

And for those who remember the bubble in Japan, a stunning comparison should put things in perspective.

click on charts to enlarge


Monday, December 3, 2012

Question Marks...

Who is this Market Viewer? He tells me to "start trading now", and then goes on a 6-week vacation.... Sorry, I paid my dues. I do not have to trade the unpredictable, fiscal cliff-induced mess. One has to experience thinly-traded holiday chop to despise it. With this out of the way, let's look at something very important... I said "I will keep my hands warm" with random posts...

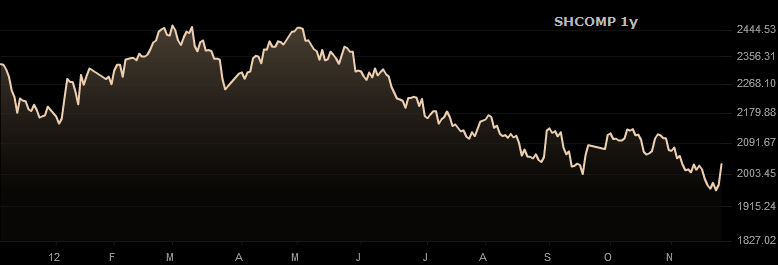
A year ago I voiced my concern about a slowing Chinese economy. Well, Shanghai Composite is sinking further below 2,000 and nobody is ringing alarm bells. It's like that's the least watched indicator. People will tell you how there are no foreign investors allowed, and it's all just a casino for locals. I am flabbergasted by what nonsense traders will come up with to discount SHCOMP below 2K, only days after they touted it when it held above that mark. Speaking of marks... The most respected market technician - Tom DeMark (whom I also deeply respect) - just slapped a 2,900 target on the index, saying that "it has bottomed, and the sellers are exhausted below 1,960, and that everyone is negative on it". But how can one be positive with lower lows and lower highs? Who the heck am I to go against God? But I will anyway. Just like in "Kung Fu Panda", my secret ingredient will have to outdo the guru's super powers. Mr. DeMark is using his proprietary indicators, 40 years in making, to come up with his prediction. I use simple support/resistance at 2K. If Index goes back above it on two successive weekly closes - you got green light. If it stays below it - you got red. My secret ingredient is - nothing, and is much older than 40 years. Not even mentioning the fact that local Chinese investors have no idea who Mr. DeMark is, and will probably lose his complicated thesis in translation and time zone difference.

A few more question marks.
First. So China has the new crew in charge - "The Magnificent Seven". I just had to do that one :) If you ask me, nothing has changed. The power is simply transferred, not relinquished, not diminished - same ole Politburo. They are flexing their muscle, doing that same old magic of manipulating the numbers. Magically, all PMIs are on the rise, exports are skyrocketing, and bank loans are shooting out of the cannon again. Can someone please tell me, how in the real world of economics, when China's three largest customers (Europe, U.S., and Japan) are slowing down, can their exports and PMIs rise?? If you can explain this one, you are a better closet economist than me.
Second. What is going on inside China is having a major effect on SHCOMP. The level of corruption is unprecedented. Amount of millionaires in Politburo is reaching new highs. Local investors are not stupid, they see what is happening around them. Shadow banking is a huge problem, with growing unpaid accounts receivable, never to be repaid I bet. Unsafe, unethical, and plain out fraudulent activities are on the rise. The newest breaking development is excessive level of chemical was found in Chinese liquor. Rule number one - do not mess with man's drink.

Folks, you cannot trade this index unless you are in China. So we, foreigners, are left with FXI. I just do not understand how longs like Doug Kass and Jim Cramer can dive into FXI and think that it will continue to disconnect from Shanghai Composite. FXI (which consists of largest 25 Chinese companies) will eventually succumb to the same fundamental valuation level of the medium and small Chinese companies. It is just a matter of time...

click on chart to enlarge